Create a Micro-Indicator Device
Introduction
In this tutorial, you will learn how to create a Dirty Watts Micro-Indicator light. This light shows at a glance when we are burning coal and gas to make our electricity. If the light is red, that means we're burning coal and gas, which is not so great for the environment. But when it's green, that means we're using sustainable, eco-friendly power! So, when you see red, you know that any power you save is helping to reduce CO2 emissions and prevent more pollution. Plus, coal and gas are only used as a backup during peak times, so your efforts to save power when the light is red are directly stopping you from adding to the pollution problem. It's as easy as that! You can be a superhero in the fight against global warming and show those fossil fuel addicts who's boss!
In this tutorial, you will learn how to create a project with a NodeMCU ESP8266 board and some NeoPixel lights. You will use these devices to display the carbon intensity of electricity generation in New Zealand. Carbon intensity is a metric that shows how much carbon dioxide is emitted per unit of electricity produced. Carbon dioxide is a greenhouse gas that contributes to global warming and climate change.
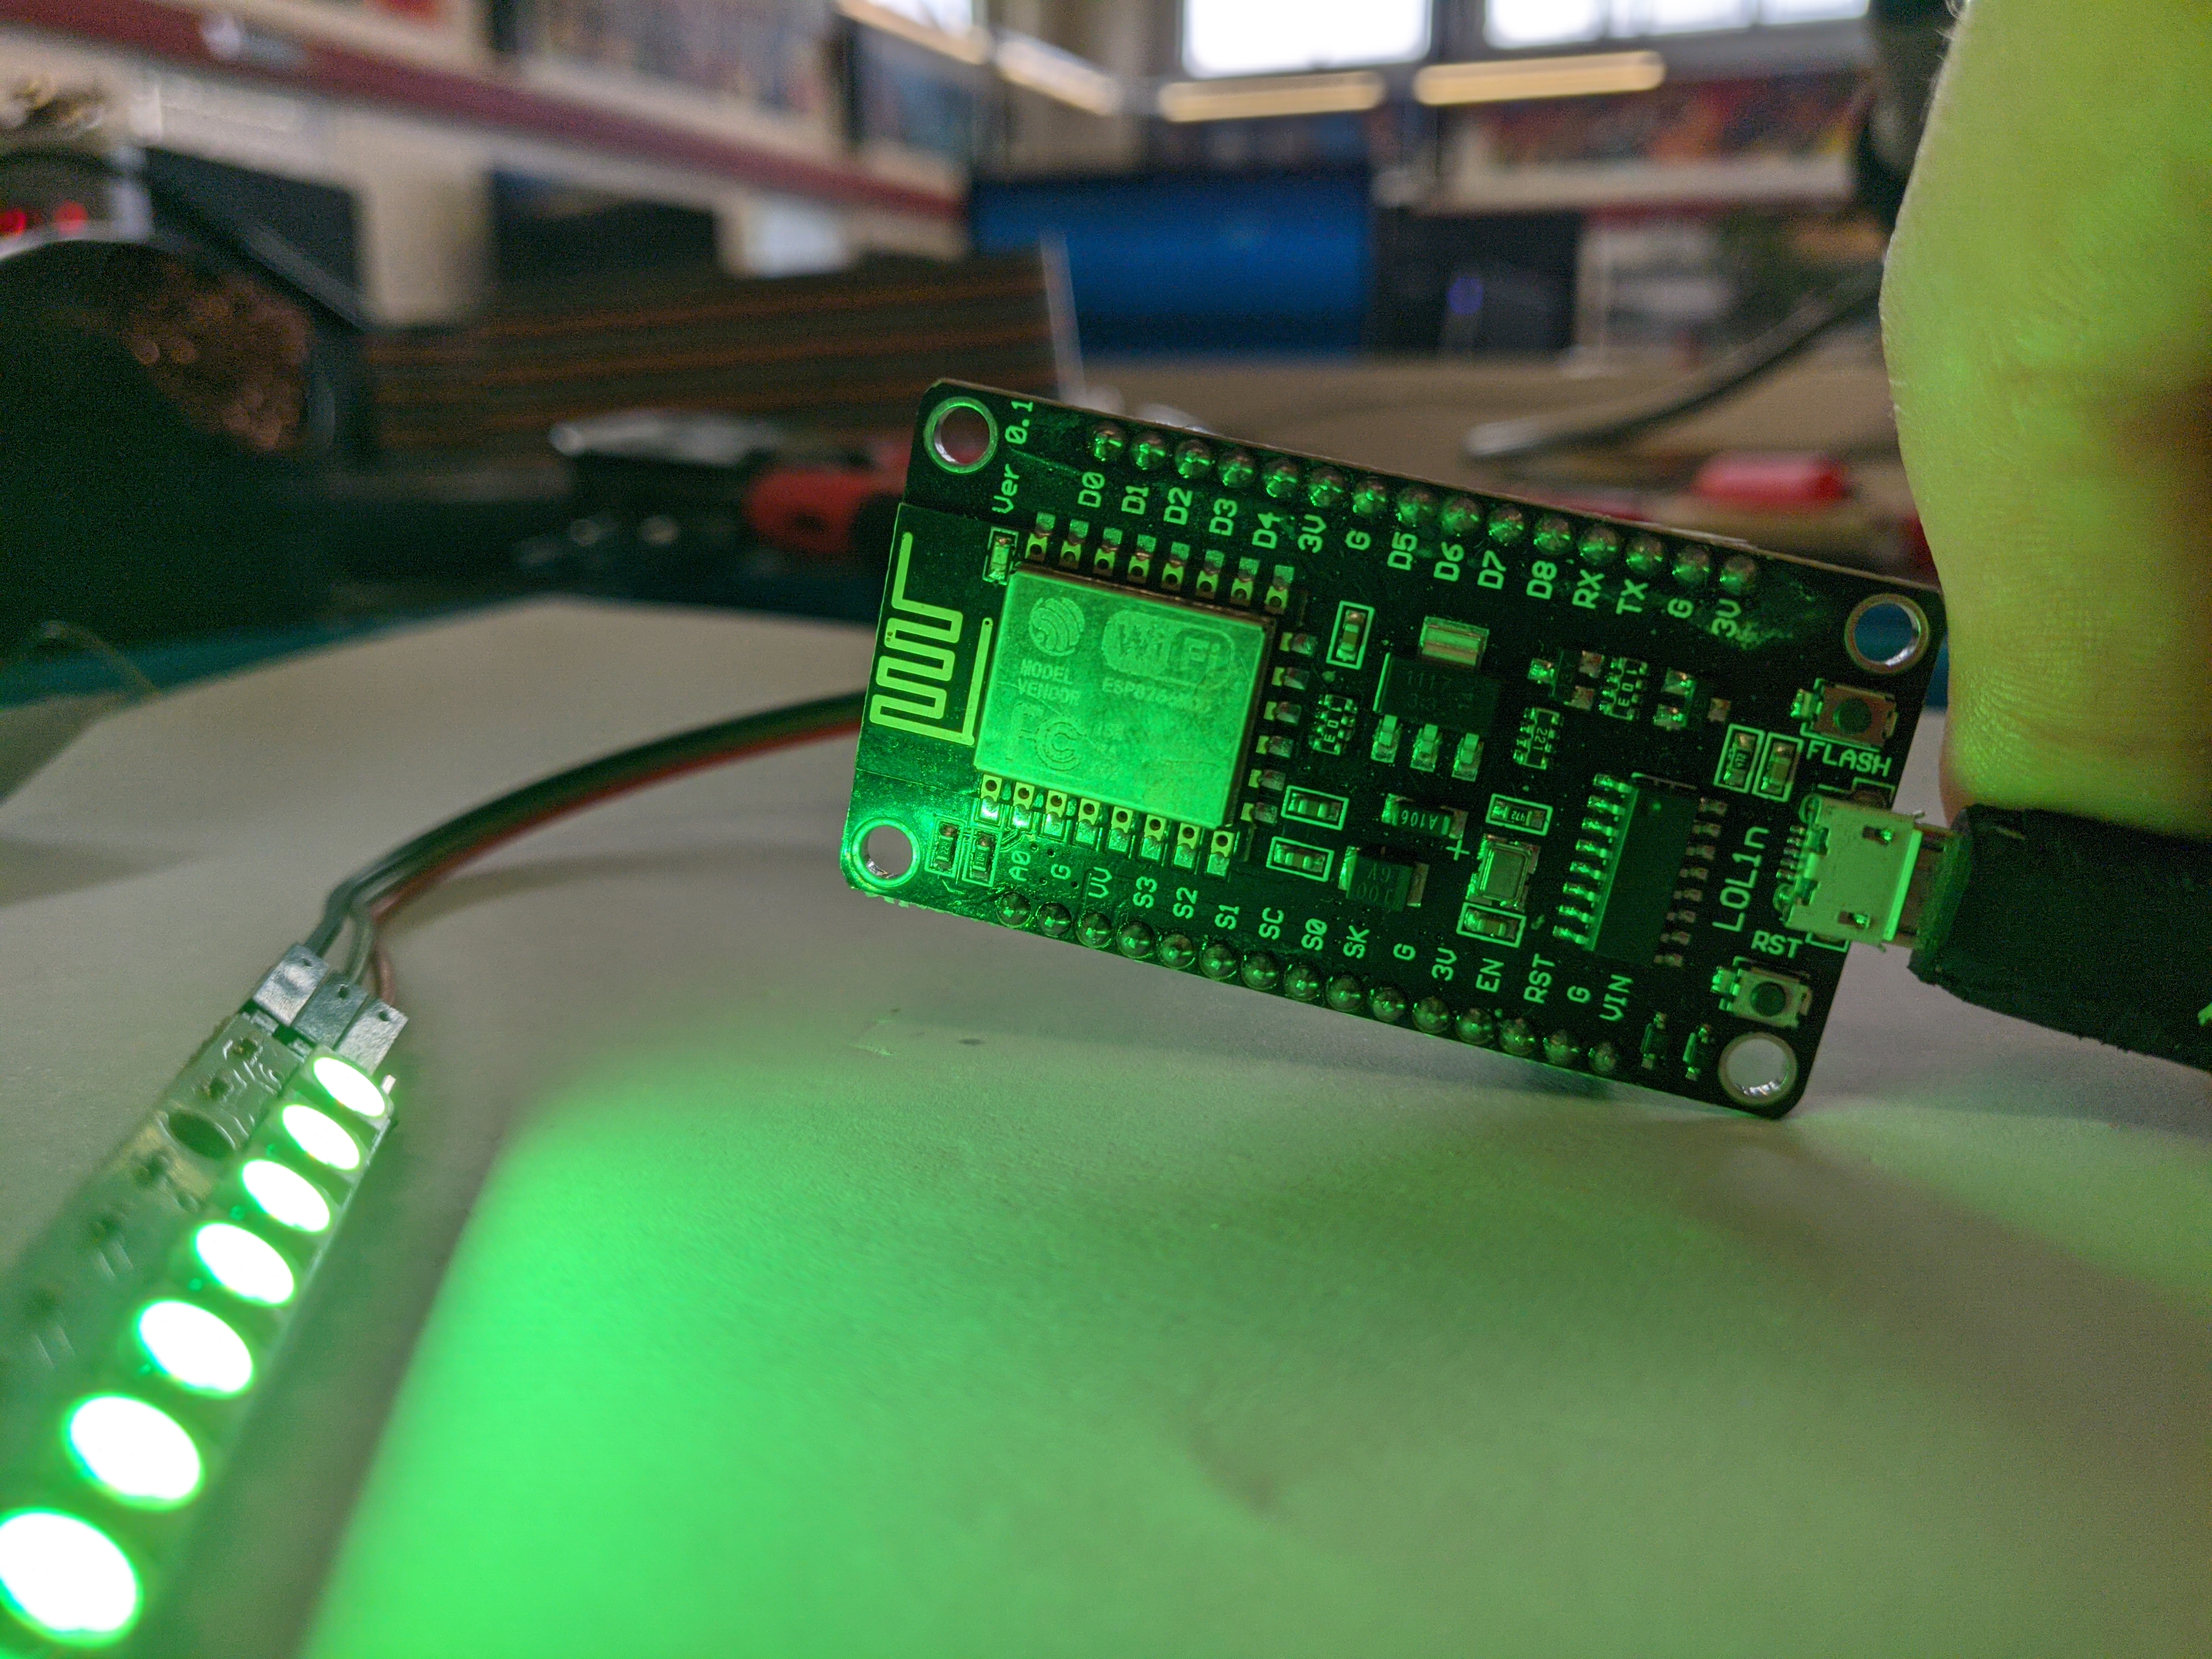
This project uses a NodeMCU ESP8266 Micro-controller, which is a terrible name for something so neat. The NodeMCU board is a microcontroller that can connect to the internet via Wi-Fi. You can program it with PlatformIO and C++, which are software tools that help you write and upload code to your board. The NeoPixel lights are RGB LEDs that can be individually controlled with a single wire.
A microcontroller is a small computer on a single chip that can perform specific tasks. It has a processor, memory, and input/output ports. A NodeMCU's single-core performance is roughly the same as the first Intel Pentium CPU from 1993, but five times faster than a standard Arduino Uno.
The dirtywatts.nz website provides real-time data on the carbon intensity and demand level of electricity in New Zealand through the dashboard, but it's designed for humans and is effectively gobbledygook to our poor microcontroller. Instead, Dirtywatts also provides an API (what's an API?) that's enables computers to get that data, read it and understand. The job of the microcontroller is to connect to wifi, download the latest data using the API, calculate a colour, and then output the colour for the LEDs.
To complete this project, you need to connect up the electronics and upload your code to the microcontroller. In that code you can change the colours and brightness as well as a bunch of other settings. Once done, you'll be able to enjoy your new desk gadget and help us stop burning carbon!
You will need the following components for this project:
There are many fakes "variations" of the official NodeMCU development boards, they will work but they might be less reliable or more finicky to get working. You can see some of them here.
Look for one with a CP2102 chip - this is the part that connects to your USB. Also an ESP32 is a bit better than a ESP8266 but for this project it will not make much difference.
Project Learning Objectives:
Software
The first thing to do is create a development environment on your computer. The DirtyWatts microcontroller uses a tool called PlatformIO to handle uploading the C++ code to the NodeMCU.
To setup your windows/macos/linux device for development:
These are the steps. Setting up your computer to do the work is one of the hard stages, so good luck!
- Download and install Git if you don't have it already. You won't be using it directly, but
- Here is some info about Git
- You can install it for Windows, MacOS (via Xcode), MacOS (via Homebrew), Linux
- Download and install Visual Studio Code (VSCode) if you don't have it already.
- VSCode is a code editor, and you can get an introduction here
- Open VS Code and install the PlatformIO extension.
- You might be used to the Arduino IDE for programming your microcontrollers. PlatformIO is the professional version of it and automatically handles installing the dependencies for your particular controller using the previously installed copy of Git.
- Here is an installation guide
- You might be used to the Arduino IDE for programming your microcontrollers. PlatformIO is the professional version of it and automatically handles installing the dependencies for your particular controller using the previously installed copy of Git.
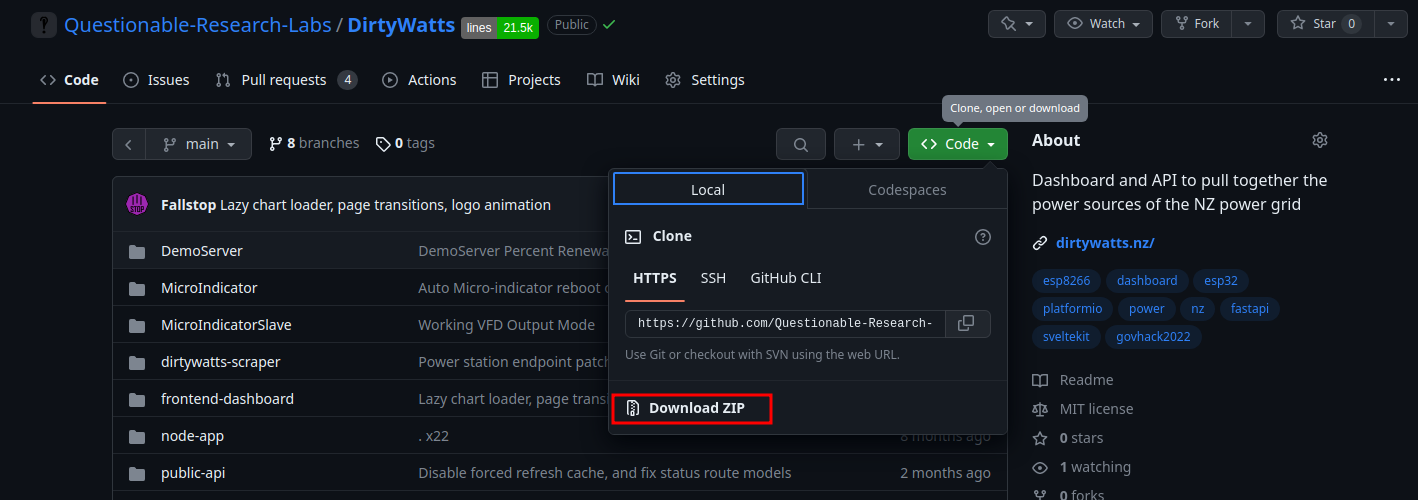
- Download and extract the DirtyWatts codebase from Questionable-Research-Labs/DirtyWatts.
-
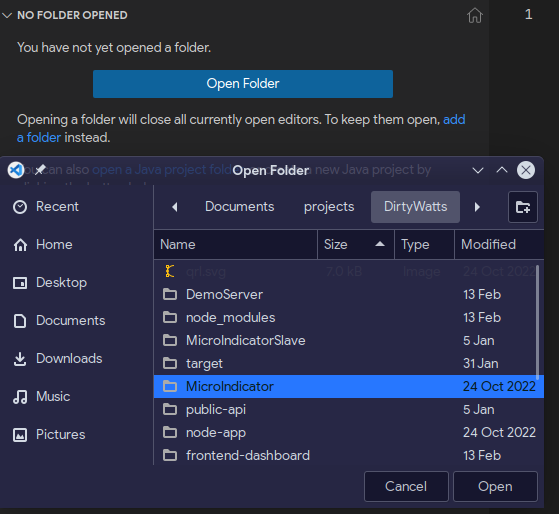
- Open the DirtyWatts/MicroIndicator folder:

Make changes to fit your device
You are now ready to start making changes to your code!
Open this file src/config.h, there are some configuration options you might need to change:
#pragma once
#ifdef OUTPUT_NEOPIXEL
// Pin that the Neo Pixels are connected to
#define NeoPixelPin D4
// Max number of LEDs in chain
#define NeoPixelCount 30
// Pixel type flags, add together as needed
// NEO_KHZ800 800 KHz bitstream (most NeoPixel products w/WS2812 LEDs)
// NEO_KHZ400 400 KHz (classic 'v1' (not v2) FLORA pixels, WS2811 drivers)
// NEO_GRB Pixels are wired for GRB bitstream (most NeoPixel products)
// NEO_RGB Pixels are wired for RGB bitstream (v1 FLORA pixels, not v2)
// NEO_RGBW Pixels are wired for RGBW bitstream (NeoPixel RGBW products)
#define NeoPixelFlags NEO_GRB + NEO_KHZ800
#endif
#define APIRequestInterval 2000 // 2 seconds, measured in milliseconds
#define ApiErrorColour 150, 150, 255 // Light Blue
#ifdef OUTPUT_RELAY
#define RelayPin 12
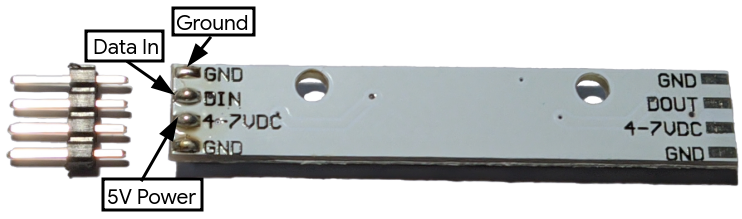
#endifThis code is for telling the microcontroller which pin you plugged the data wire into.
See the #define NeoPixelPin D1 This creating a variable (a name) called NeoPixelPin and giving it the value D1. If you plugged your data wire into a different pin, you can use say what it is here. You probably don't need to do that.
Next see the #define NeoPixelCount 30 This is making another variable (name) called NeoPixelCount. This is for holding the number of pixels in your display. The example has 30 (which is a lot). You will probably have a lot less. Count every single pixel in your display and replace the 30 with your number.
Here, you can change the colour shown when it can't connect to the Dirtywatts Servers, change how often it polls new data, and configure other platform features.
Upload the code
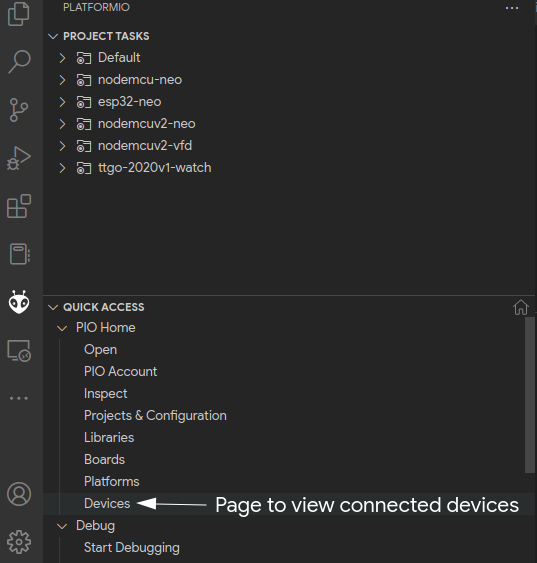
First, you want to check that PlatformIO can see the device. Plug your NodeMCU via a micro USB cable into your computer; if everything goes right, it will automatically pick it up.
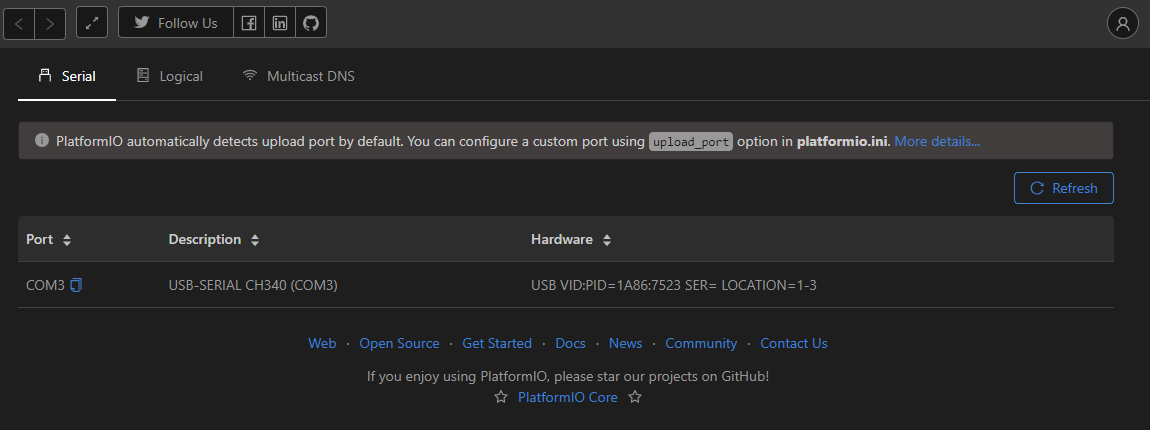
If it doesn't show here, then your NodeMCU is detected/recognised by your computer. The first thing to check is to try a new USB cable and port. It needs to be able to carry data which quite a few of the cheap cables can't. You might need to install a driver, so check the bottom of your NodeMCU to see if it wants you to install a driver for a 'CH304g', 'CP2021', etc. As a last step, you can also reflash the firmware.
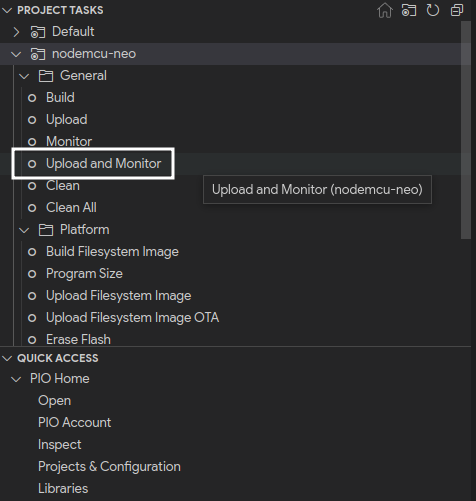
If your NodeMCU shows up, great! Let's upload and monitor the result using the PROJECT TASKS panel and expand the correct compile target according to the following table:
Development Board Name |
Compile Target |
| ESP8266 ESP-12 NodeMCU (v0.9) | nodemcu-neo |
| ESP8266 ESP-12E NodeMCU (v2) | nodemcuv2-neo |
| ESP8266 ESP-12E NodeMCU (v3) | nodemcuv2-neo |
| ESP32 Development Board | esp32-neo |
| Wesmos S2 Mini | esp32-s2-neo |
If you're unsure, you can always try them all! It won't permanently brick your board, but it will fail to upload with possibly weird errors.
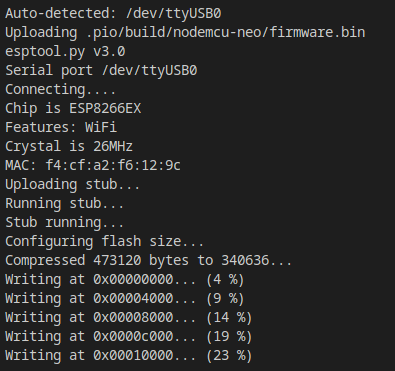
When you are ready, run the "Upload and Monitor" task; hopefully, it will start uploading!
Now you've got your brain programmed, you're onto soldering up your lights!
Hardware
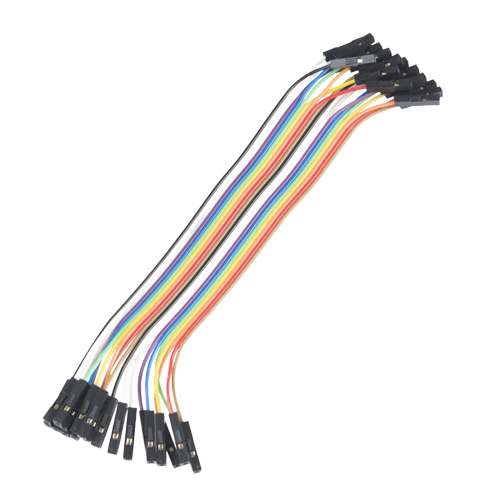
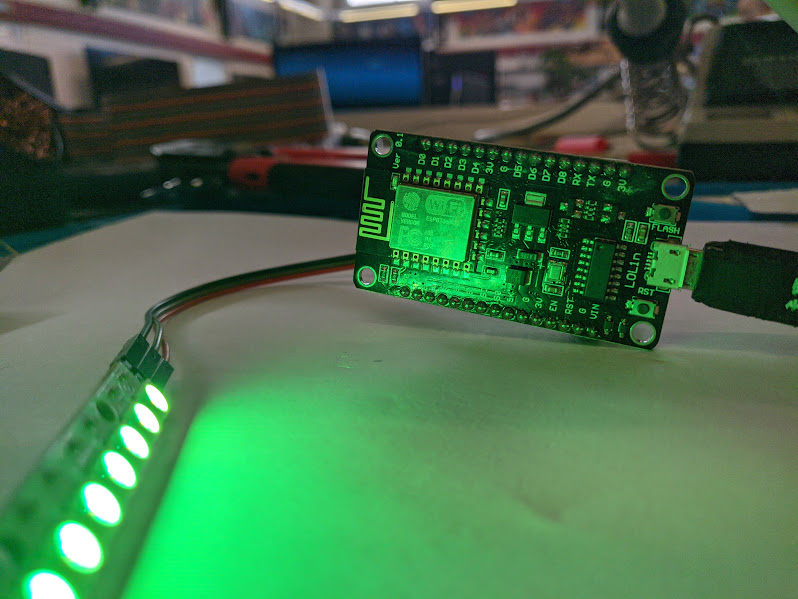
The second step is to hook up your now programmed microcontroller to your lights. We only need three wires, two for power (black and red), and one for data (green).
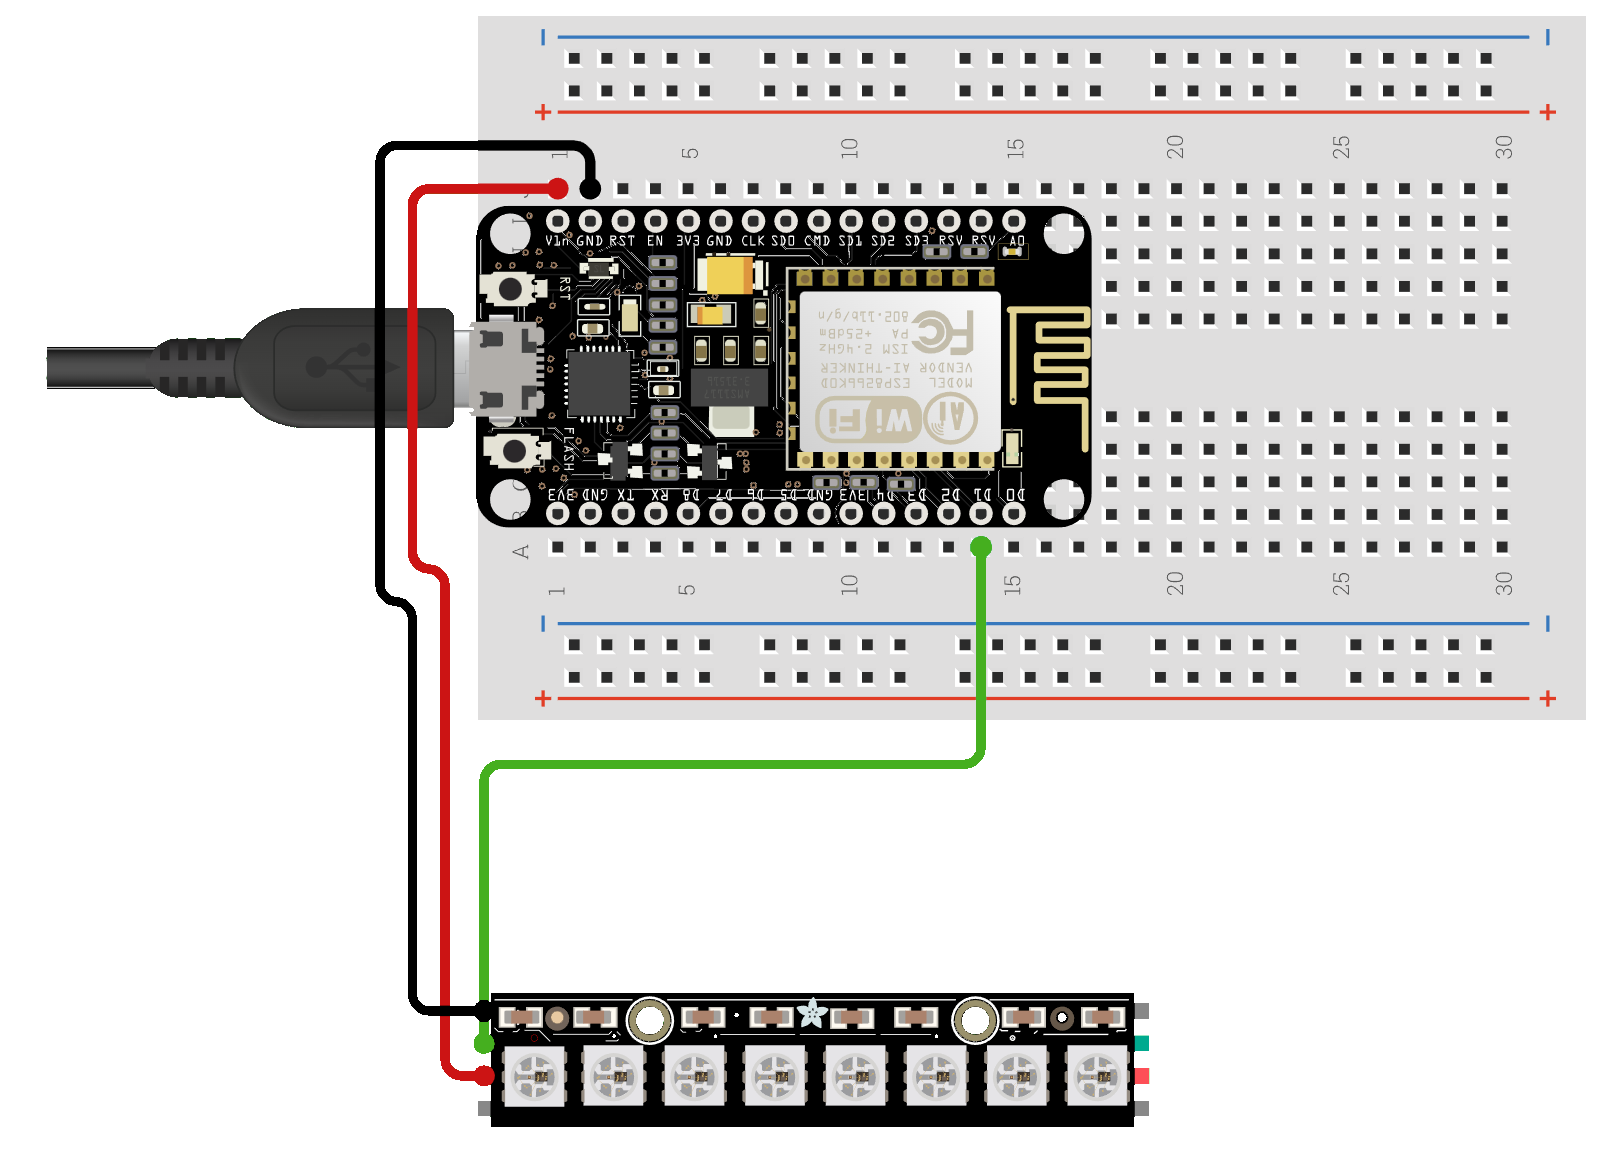
Follow these steps:
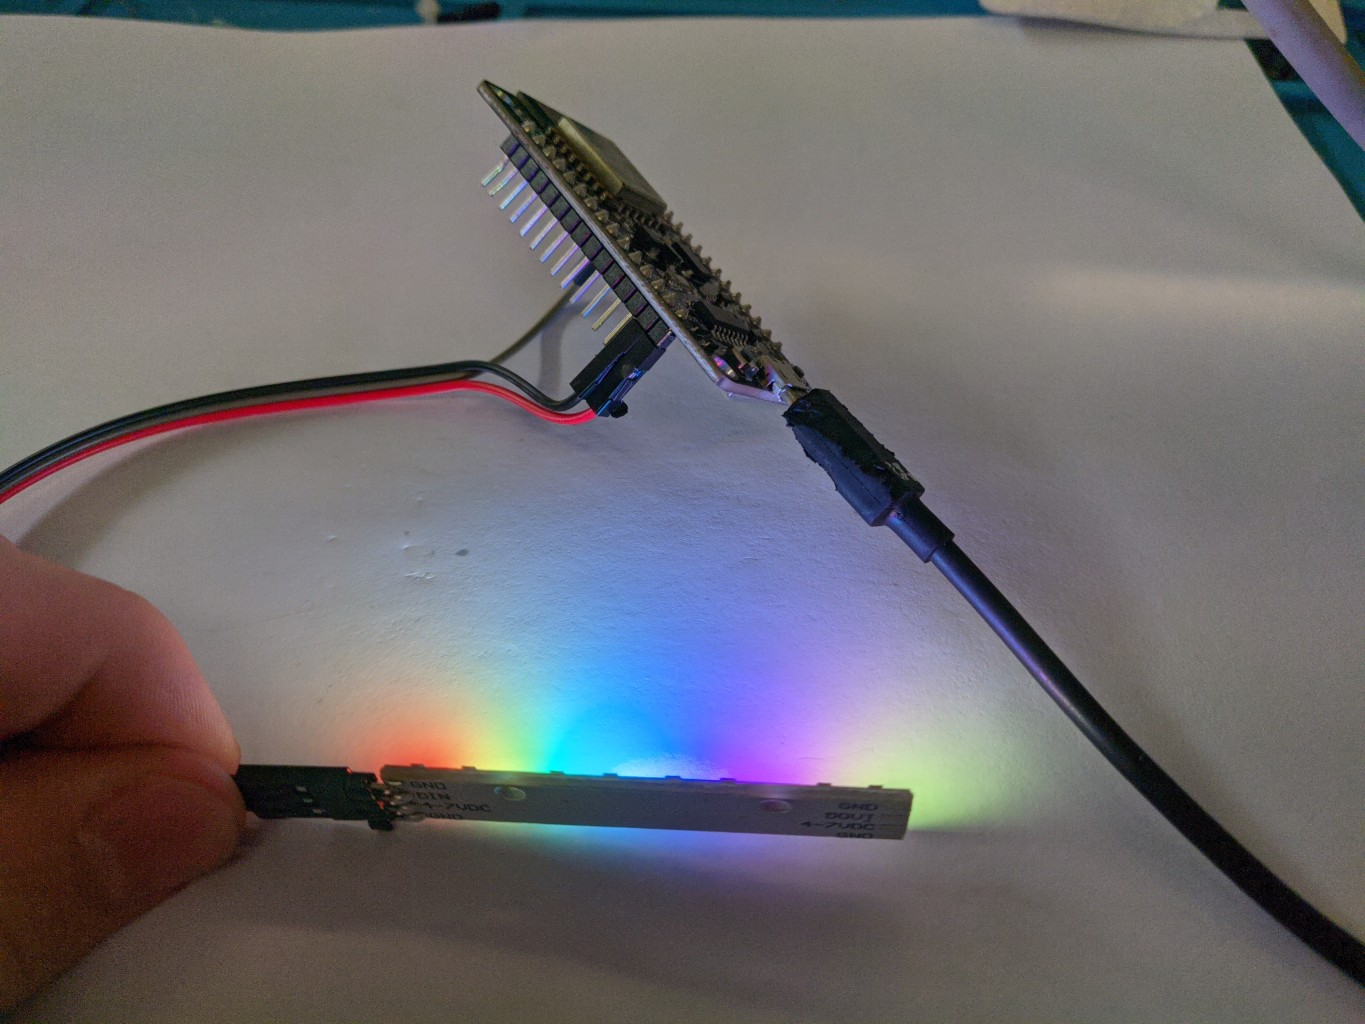
If every is successful, when you plug in your NodeMCU, it should show the default rainbow!
Wifi Configuration
When you have uploaded your code and the device starts up for the first time, it will spit out a bunch of messages saying it can't find a saved wifi network. Let's fix that!
.....
*wm:Connect Wifi, ATTEMPT # 2 of 6
*wm:No wifi saved, skipping
*wm:Connect Wifi, ATTEMPT # 3 of 6
*wm:No wifi saved, skipping
*wm:Connect Wifi, ATTEMPT # 4 of 6
*wm:No wifi saved, skipping
*wm:Connect Wifi, ATTEMPT # 5 of 6
*wm:No wifi saved, skipping
*wm:Connect Wifi, ATTEMPT # 6 of 6
*wm:No wifi saved, skipping
*wm:AutoConnect: FAILED for 6004 ms
*wm:StartAP with SSID: ESP_F6129C
*wm:AP IP address: 192.168.4.1
*wm:[ERROR] country code not found
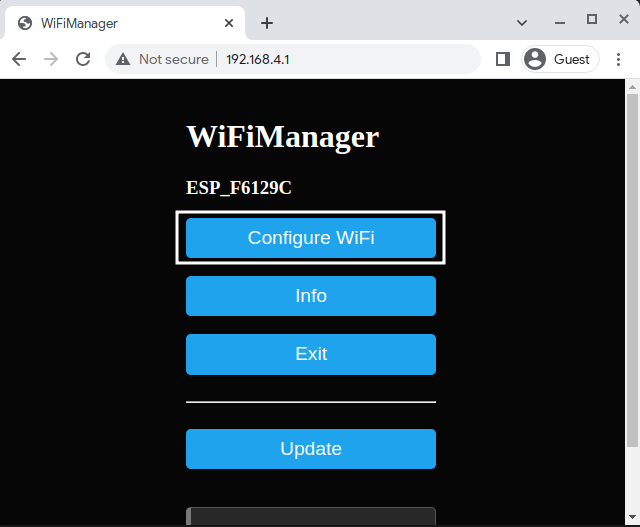
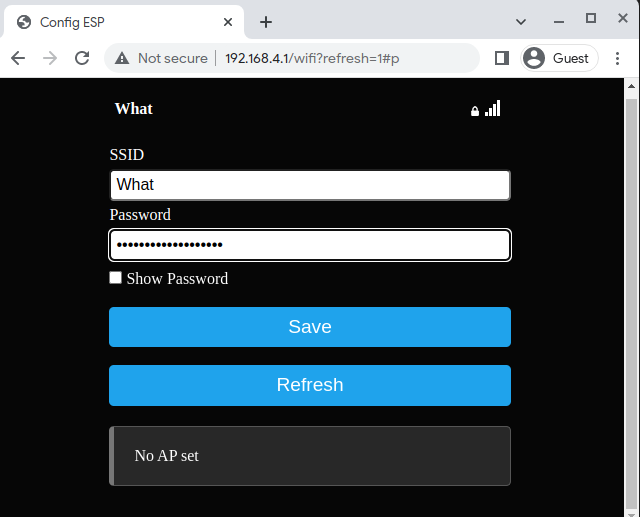
*wm:Starting Web Portal For your MicroIndicator to download the latest data, it needs to connect to the internet through your wifi. To give it the wifi password, connect the hotspot it just created.
In the above case, it's called ESP_F6129C, and it'll open a captive portal when you connect:
![]()
If it doesn't automatically pop up for you, go to http://192.168.4.1/ in any web browser.
If you connect successfully, press Configure Wifi:
Then, you can click your Wifi network in the scan results, enter your Wifi Password, and save.
If your wifi network doesn't show in the scan results, your NodeMCU might not support it. Please ensure the wifi network has 2.4 GHz support and your NodeMCU is close enough to the router.
Once saved, it should connect!
...
wm:2 networks found
*wm:Connect Wifi, ATTEMPT # 1 of 6
*wm:Connecting to NEW AP: What
*wm:connectTimeout not set, ESP waitForConnectResult...
*wm:Connect to new AP [SUCCESS]
*wm:Got IP Address:
*wm:192.168.130.9
*wm:config portal exiting
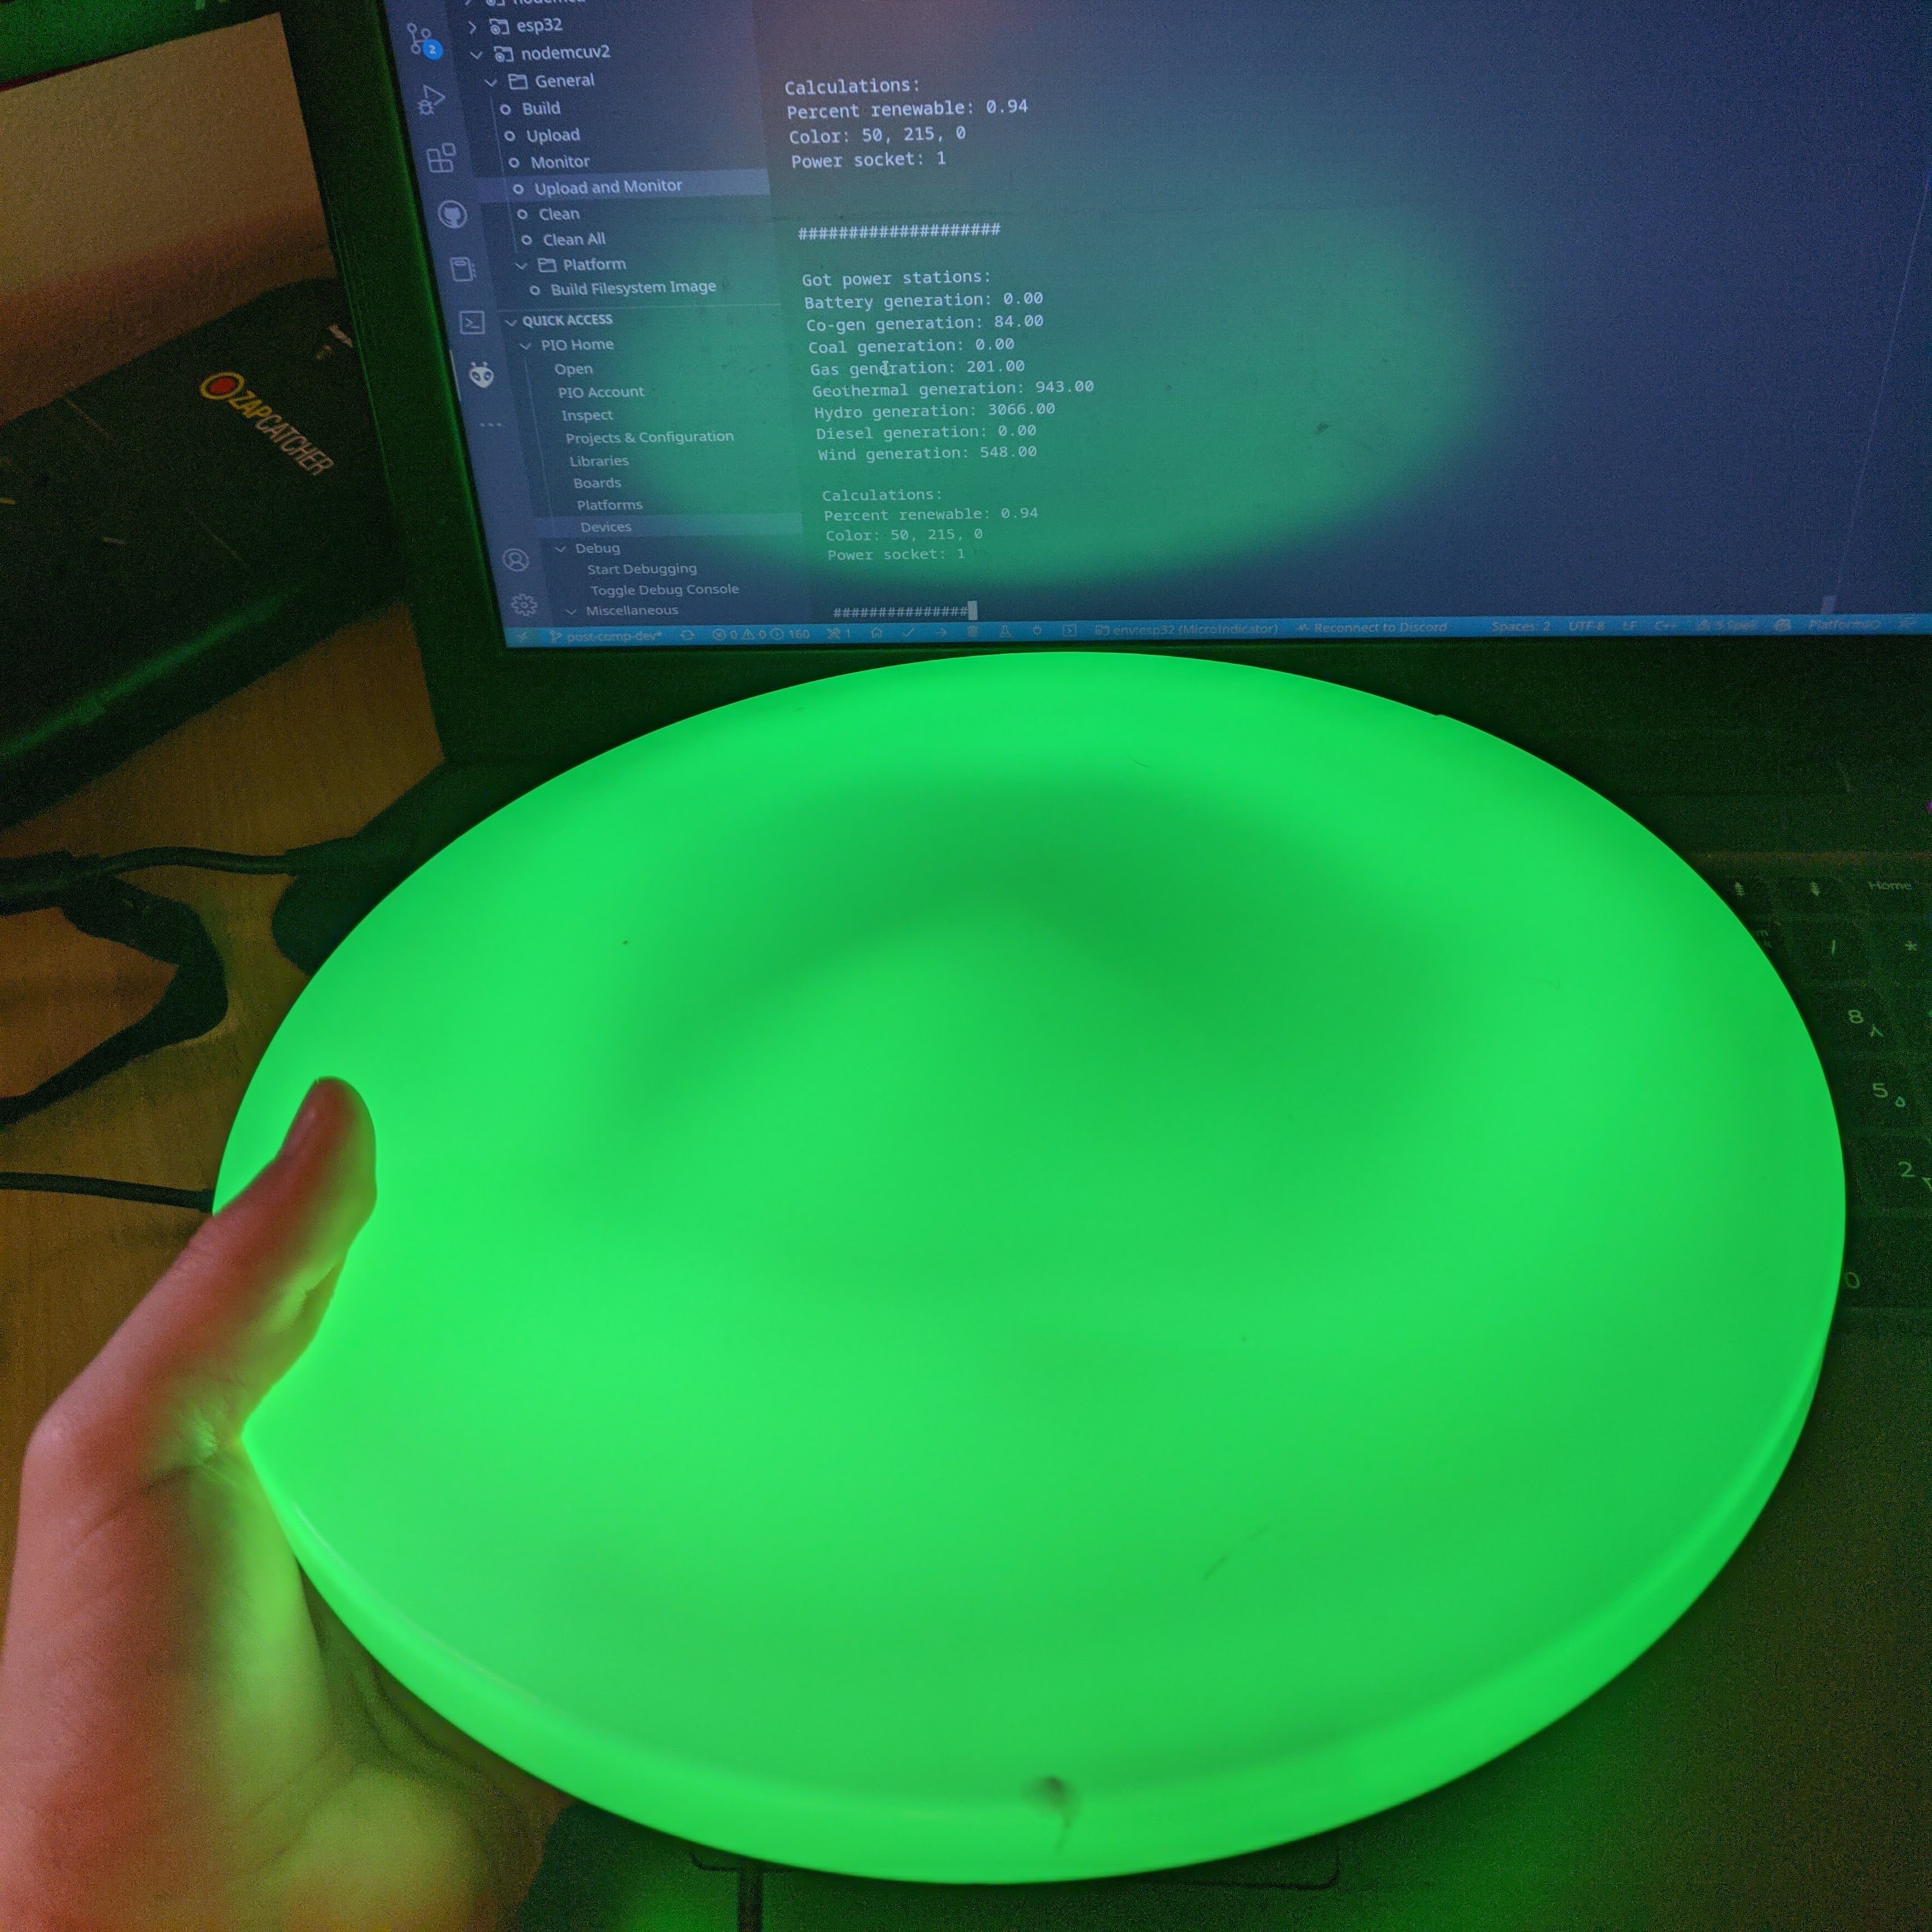
Wifi Setup CompleteIf it can connect back to the DirtyWatts Server, it'll start spitting out stats about the power grid:
####################
Got power stations:
Battery generation: 0.00
Co-gen generation: 118.00
Coal generation: 102.00
Gas generation: 209.00
Geothermal generation: 796.00
Hydro generation: 2702.00
Diesel generation: 0.00
Wind generation: 378.00
Calculations:
Percent renewable: 0.90
Color: 174, 74, 0
Power socket: 0
####################If it doesn't and instead fails to connect to the server, it could be because of many reasons. It could be due to a captive portal on the wifi blocking access, in which case you will need to find a different wifi network or the Dirtywatts API is offline for everyone!
Scoring Algorithm
Unfortunately, we can't display every part of the power grid on one light, but we can “summarise” that information into one metric. That summarisation process is called a Scoring Algorithm. That metric is configurable, and there are lots of options. Here's my favourite two:
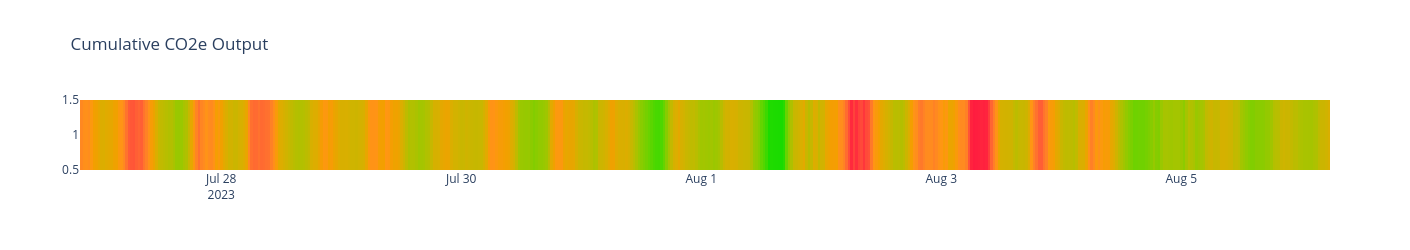
Cumulative CO2e Emissions
This is the default metric used for your Micro-Indicator
The total CO2e being released by New Zealand's grid at this moment, in Tonnes/hour. Heavily influenced by the current power output of the grid, making it cycle on a daily basis. It shows how "strained" the power-grid currently is.
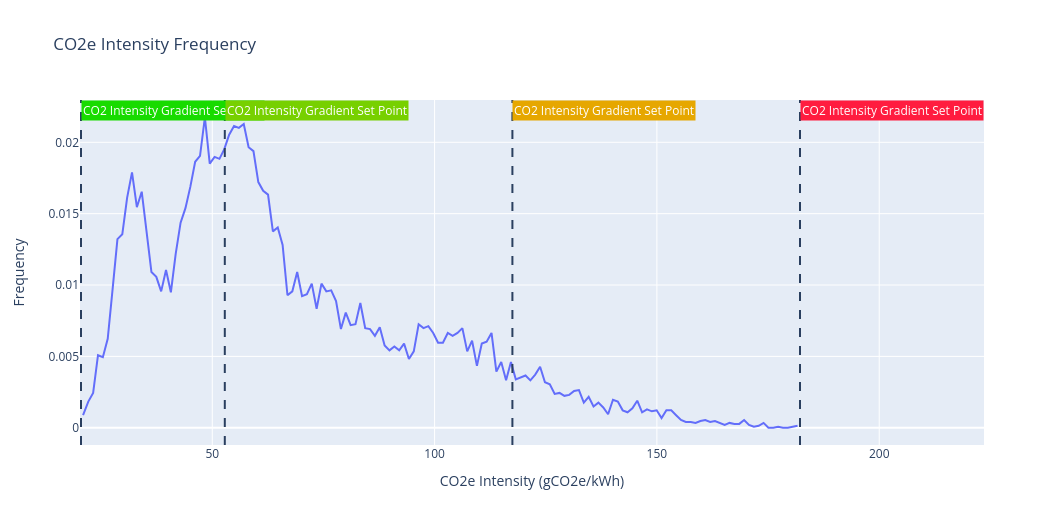
CO2e Intensity
The amount of extra CO2e emitted by the grid if you turned on an appliance, in gCO2e/kWh. Heavily influenced by sources of power and the operational status of power-plants, meaning it has much longer cycles than the Cumulative Output.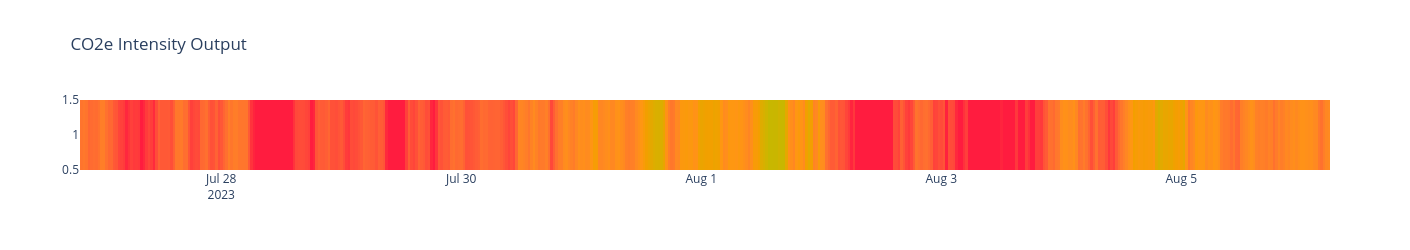
Changing the Scoring Algorithm
To change from the default Cumulative CO2e Emissions metric, you'll need to start by looking in src/powerstations.cpp line 71, and swap it from the calculating from the emission data, to the intensity data.
Changing:
// Calculate colour using new scoring algorithm
DoubleRange scoring_range = { CO2E_EMISSIONS_RANGE_MIN, CO2E_EMISSIONS_RANGE_MAX };
double scoring_datum = this->co2e_emissions;
// DoubleRange scoring_range = { CO2E_INTENSITY_RANGE_MIN, CO2E_INTENSITY_RANGE_MAX };
// double scoring_datum = this->co2e_intensity;To:
// Calculate colour using new scoring algorithm
// DoubleRange scoring_range = { CO2E_EMISSIONS_RANGE_MIN, CO2E_EMISSIONS_RANGE_MAX };
// double scoring_datum = this->co2e_emissions;
DoubleRange scoring_range = { CO2E_INTENSITY_RANGE_MIN, CO2E_INTENSITY_RANGE_MAX };
double scoring_datum = this->co2e_intensity;When you re-upload your code, your device will now show the CO2e Intensity colour scale.
The scoring_range is calculated in this Juypter Notebook, and uses the max/min values from August 2022 -> August 2023
Algorithm Dissection
There are three pieces of data we use to decide what colour to show:
- The
scoring_datum, the cumulative CO2e emissions or intensity metric - The
scoring_range, the set min/max possible values of the metric - The
colourRange, the set point RGB colours calculated from the Oklab colour space in this notebook. There are two colour options: one for screens and another for lights. They were designed to match each other across both light and screen Micro-Indicators.
With those values, we can find the position of the metric in the range of values, and map that onto the closest colour in the colourRange.
The function calculating this, PowerStations::calculateInstructionPoint(), starts off by clearing all the previous calculations:
void PowerStations::calculateInstructionPoint()
{
// Initialise the instruction point
memset(instructionPoint.colorScreen, 0, sizeof(instructionPoint.colorScreen)); // fill the array with zeros
memset(instructionPoint.colorLight, 0, sizeof(instructionPoint.colorLight)); // fill the array with zeros
instructionPoint.percentRenewable = 0;
instructionPoint.powerSocketEnabled = true;
Then, it calculates the percentage renewable power according to the following table. It doesn’t use the percentage to calculate the colour but is worked out to be displayed in text outputs, such as in a Watch face.
| Non-renewable Energy |
Renewable Energy |
| Coal | Hydropower |
| Gas | Wind |
| Cogeneration | Geothermal |
| Diesel |
// Calculate the total generation
double totalRenewable = this->geothermal.generation_mw + this->hydro.generation_mw + this->wind.generation_mw;
double totalNonRenewable = this->co_gen.generation_mw + this->coal.generation_mw + this->gas.generation_mw + this->diesel.generation_mw;
double totalGeneration = totalRenewable + totalNonRenewable;
...
double percentageRenewable = totalRenewable / totalGeneration;
instructionPoint.percentRenewable = percentageRenewable;After it's got that, it starts working out what colour to turn your light by choosing which piece of data to work from:
// Calculate colour using new scoring algorithm
DoubleRange scoring_range = { CO2E_EMISSIONS_RANGE_MIN, CO2E_EMISSIONS_RANGE_MAX };
double scoring_datum = this->co2e_emissions;
// DoubleRange scoring_range = { CO2E_INTENSITY_RANGE_MIN, CO2E_INTENSITY_RANGE_MAX };
// double scoring_datum = this->co2e_intensity;Which it then can use to find the colour index to show:
double scoring_datum_norm = max(min(scoring_datum, scoring_range.max), scoring_range.min);
double scoring_datum_percent = (scoring_datum_norm - scoring_range.min) / (scoring_range.max - scoring_range.min);
int colour_index = round(scoring_datum_percent * (COLOUR_MAP_LENGTH - 1));Then it copies the colour from the two colour maps into the data structure with the rest of the power station summary information.
memcpy(instructionPoint.colorLight, colourRangeLight[colour_index], sizeof(instructionPoint.colorLight));
memcpy(instructionPoint.colorScreen, colourRangeScreen[colour_index], sizeof(instructionPoint.colorScreen));Lights and screens have separate colour maps to make them match with each other, they are both generated from the same scientific colour scale here.
As its last step, it calculates if a power socket should be turned on for Smart Socket Micro-Indicators. If the metric is in its best half, the power socket should be enabled.
// Calculate power socket recommendation
instructionPoint.powerSocketEnabled = scoring_datum_percent < 0.5;There you go! That's basically the whole thing, from top to bottom. With this information, you might want to look into developing your own metrics. What about an indicator which only turned when coal power is being used? It's up to you to make your indicator unique. Every time you are ready to test your changes, you can plug in your NodeMCU and use the same Upload and Monitor button as before.
Continued Development
Here are some ideas for pathways to continue developing your DirtyWatts Micro-Indicator once you have tried out customising the Algorithm.
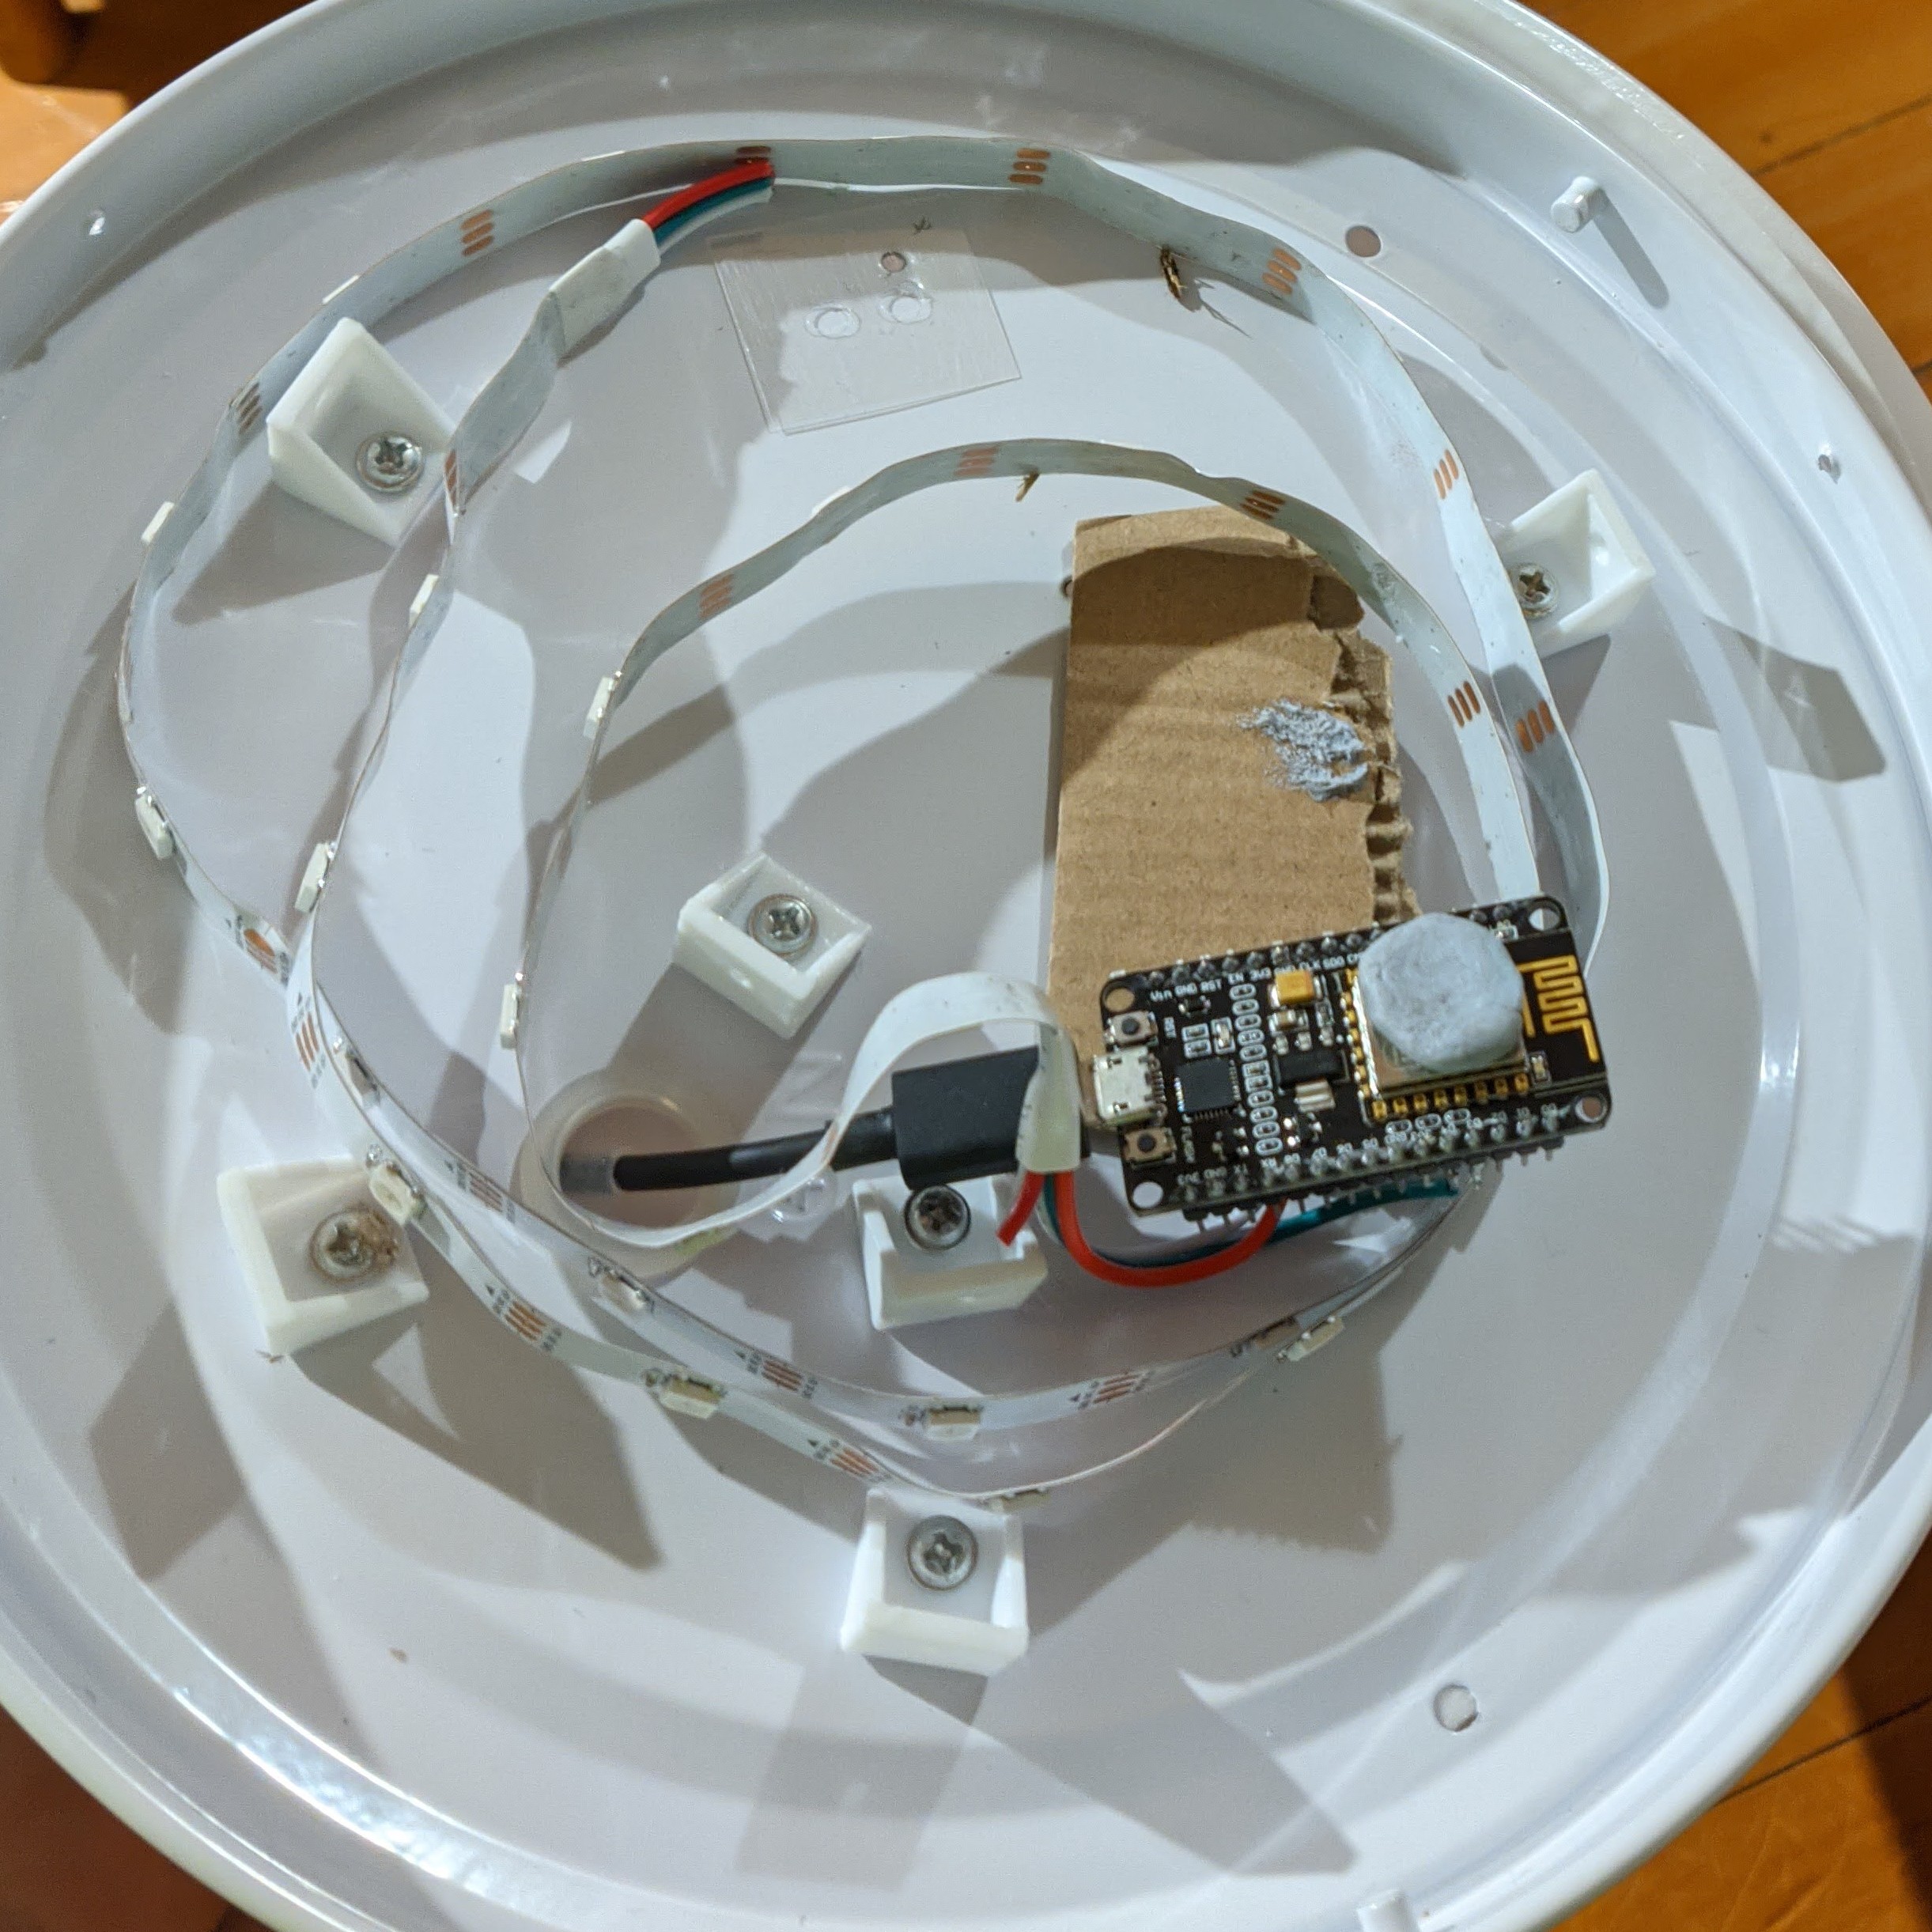
Case
You’ve got a pile of electronics, but nothing to hold the guts in. You could make a case from anything! You could design and 3D print one, laser cut one, or even cobble together one out of a cardboard box.
It’s a good idea to diffuse the light coming out of your LEDs, you can use baking paper, translucent acrylic, or a wall mount LED housing from a home-improvement store.
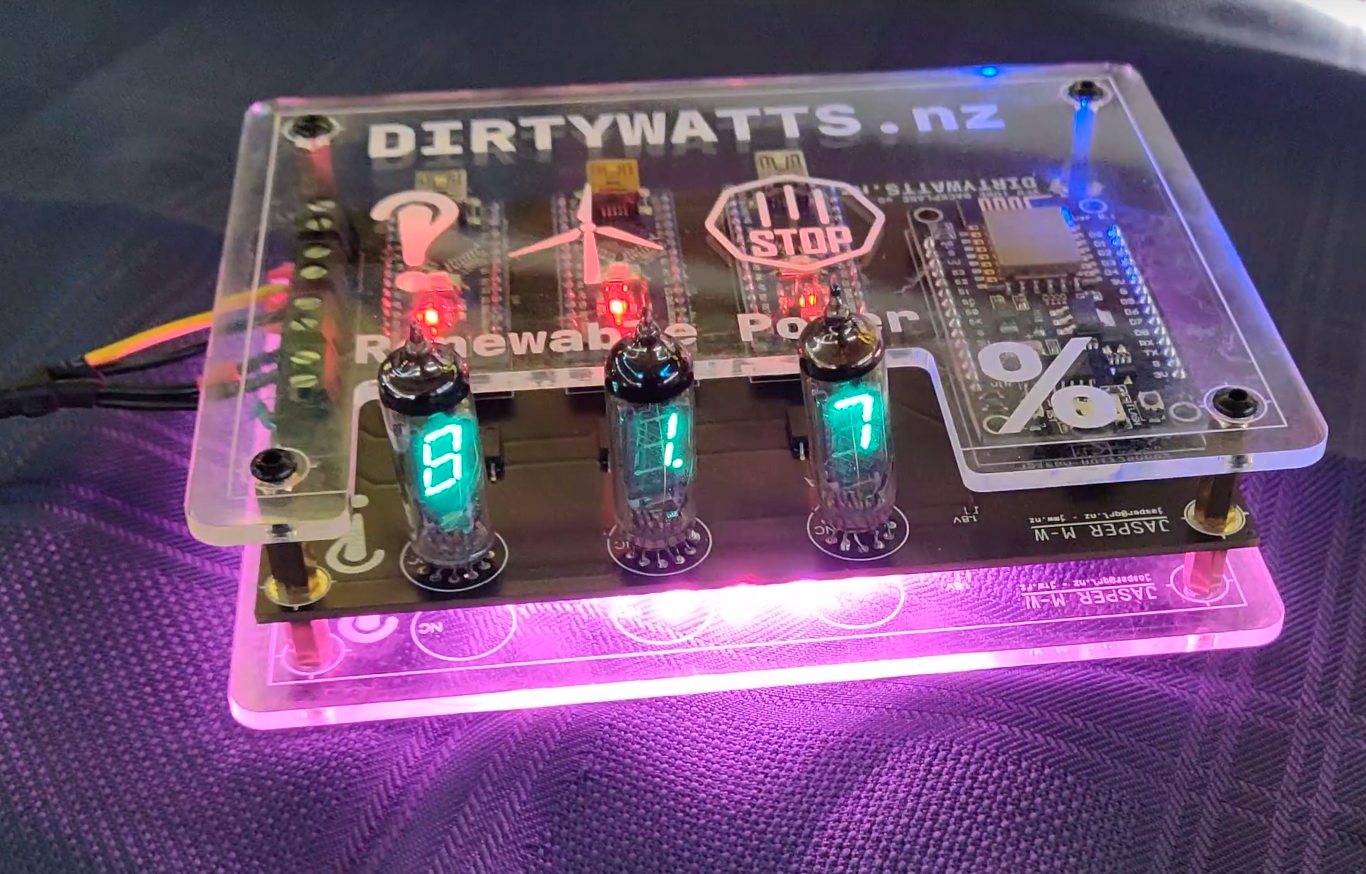
Alternative Outputs
There’s no reason you have to stick to the addressable LED outputs, try hooking up other outputs! The same place you configure the NeoPixel LEDs, you could also configure and output to a dot-matrix display, display the percent renewable on a couple of 8 segment displays, etc. How can you add more useful dimensions to the output?
Battery Powered
Right now, your NodeMCU has to be connected to a computer or wall-socket to run. What about giving your Micro-Indicator freedom from the wall? You could build a standard USB power pack into your case, or get a bit more fancy and run some rechargeable batteries with a voltage regulator into the 5v port on the microcontroller.
Light Animations
You've got these fancy NeoPixel LED's as your indicator light, which lets you control every single LED individually. We've been taking a hammer to that feature by controlling the whole strip as one block. You can change that, and unlock its superpower! You could make animations when it features new data, or you could even convey more dimensions than just a single colour through partitioning your lights.