Scoring Algorithm
Unfortunately, we can't display every part of the power grid on one light, but we can “summarise” that information into one metric. That summarisation process is called a Scoring Algorithm. That metric is configurable, and there are lots of options. Here's my favourite two:
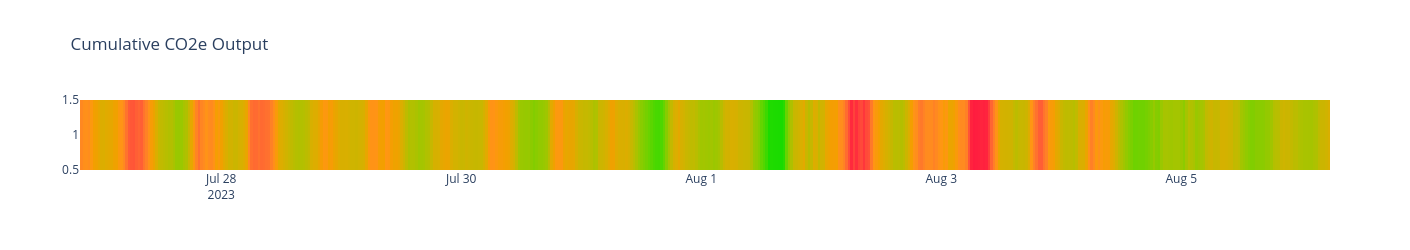
Cumulative CO2e Emissions
This is the default metric used for your Micro-Indicator
The total CO2e being released by New Zealand's grid at this moment, in Tonnes/hour. Heavily influenced by the current power output of the grid, making it cycle on a daily basis. It shows how "strained" the power-grid currently is.
CO2e Intensity
The amount of extra CO2e emitted by the grid if you turned on an appliance, in gCO2e/kWh. Heavily influenced by sources of power and the operational status of power-plants, meaning it has much longer cycles than the Cumulative Output.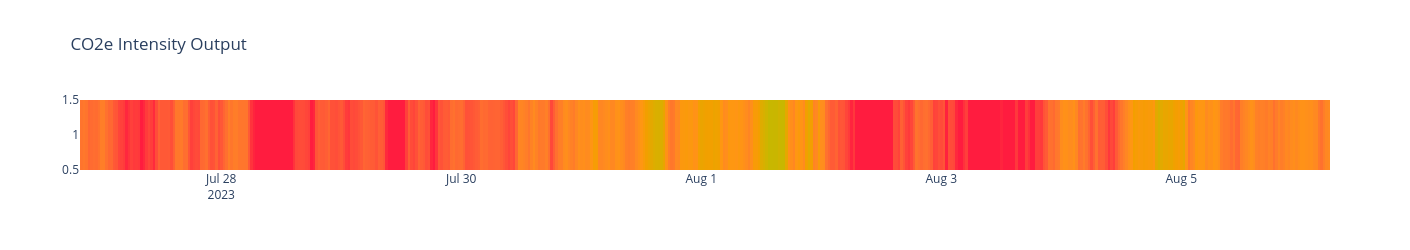
Changing the Scoring Algorithm
To change from the default Cumulative CO2e Emissions metric, you'll need to start by looking in src/powerstations.cpp line 71, and swap it from the calculating from the emission data, to the intensity data.
Changing:
// Calculate colour using new scoring algorithm

DoubleRange scoring_range =  { CO2E_EMISSIONS_RANGE_MIN, CO2E_EMISSIONS_RANGE_MAX };
double scoring_datum = this->co2e_emissions;

// DoubleRange scoring_range =  { CO2E_INTENSITY_RANGE_MIN, CO2E_INTENSITY_RANGE_MAX };
// double scoring_datum = this->co2e_intensity;
To:
// Calculate colour using new scoring algorithm

// DoubleRange scoring_range =  { CO2E_EMISSIONS_RANGE_MIN, CO2E_EMISSIONS_RANGE_MAX };
// double scoring_datum = this->co2e_emissions;

DoubleRange scoring_range =  { CO2E_INTENSITY_RANGE_MIN, CO2E_INTENSITY_RANGE_MAX };
double scoring_datum = this->co2e_intensity;
When you re-upload your code, your device will now show the CO2e Intensity colour scale.
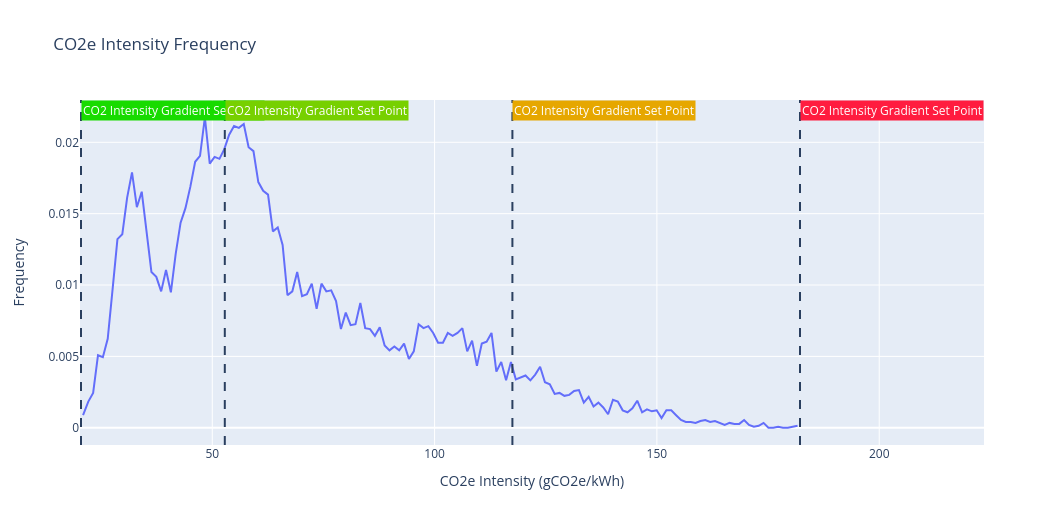
The scoring_range is calculated in this Juypter Notebook, and uses the max/min values from August 2022 -> August 2023
Algorithm Dissection
There are three pieces of data we use to decide what colour to show:
- The
scoring_datum, the cumulative CO2e emissions or intensity metric - The
scoring_range, the set min/max possible values of the metric - The
colourRange, the set point RGB colours calculated from the Oklab colour space in this notebook. There are two colour options: one for screens and another for lights. They were designed to match each other across both light and screen Micro-Indicators.
With those values, we can find the position of the metric in the range of values, and map that onto the closest colour in the colourRange.
The function calculating this, PowerStations::calculateInstructionPoint(), starts off by clearing all the previous calculations:
void PowerStations::calculateInstructionPoint()
{
    // Initialise the instruction point
    memset(instructionPoint.colorScreen, 0, sizeof(instructionPoint.colorScreen)); // fill the array with zeros
    memset(instructionPoint.colorLight, 0, sizeof(instructionPoint.colorLight)); // fill the array with zeros

    instructionPoint.percentRenewable = 0;
    instructionPoint.powerSocketEnabled = true;
Then, it calculates the percentage renewable power according to the following table. It doesn’t use the percentage to calculate the colour but is worked out to be displayed in text outputs, such as in a Watch face.
| Non-renewable Energy |
Renewable Energy |
| Coal | Hydropower |
| Gas | Wind |
| Cogeneration | Geothermal |
| Diesel |
// Calculate the total generation
double totalRenewable = this->geothermal.generation_mw + this->hydro.generation_mw + this->wind.generation_mw;
double totalNonRenewable = this->co_gen.generation_mw + this->coal.generation_mw + this->gas.generation_mw + this->diesel.generation_mw;

double totalGeneration = totalRenewable + totalNonRenewable;

...

double percentageRenewable = totalRenewable / totalGeneration;
instructionPoint.percentRenewable = percentageRenewable;
After it's got that, it starts working out what colour to turn your light by choosing which piece of data to work from:
// Calculate colour using new scoring algorithm

DoubleRange scoring_range =  { CO2E_EMISSIONS_RANGE_MIN, CO2E_EMISSIONS_RANGE_MAX };
double scoring_datum = this->co2e_emissions;

// DoubleRange scoring_range =  { CO2E_INTENSITY_RANGE_MIN, CO2E_INTENSITY_RANGE_MAX };
// double scoring_datum = this->co2e_intensity;
Which it then can use to find the colour index to show:
double scoring_datum_norm = max(min(scoring_datum, scoring_range.max), scoring_range.min);
double scoring_datum_percent = (scoring_datum_norm - scoring_range.min) / (scoring_range.max - scoring_range.min);
int colour_index = round(scoring_datum_percent * (COLOUR_MAP_LENGTH - 1));
Then it copies the colour from the two colour maps into the data structure with the rest of the power station summary information.
memcpy(instructionPoint.colorLight, colourRangeLight[colour_index], sizeof(instructionPoint.colorLight));
memcpy(instructionPoint.colorScreen, colourRangeScreen[colour_index], sizeof(instructionPoint.colorScreen));
Lights and screens have separate colour maps to make them match with each other, they are both generated from the same scientific colour scale here.
As its last step, it calculates if a power socket should be turned on for Smart Socket Micro-Indicators. If the metric is in its best half, the power socket should be enabled.
// Calculate power socket recommendation
instructionPoint.powerSocketEnabled = scoring_datum_percent < 0.5;
There you go! That's basically the whole thing, from top to bottom. With this information, you might want to look into developing your own metrics. What about an indicator which only turned when coal power is being used? It's up to you to make your indicator unique. Every time you are ready to test your changes, you can plug in your NodeMCU and use the same Upload and Monitor button as before.